
| Previous Page | Experiments Menu | Main Menu | Next Page |
|---|
Detecting single photons is quite demanding. As shown on page 1, the energy of a single photon is only about 3.6x10⁻¹⁹J. Some special video cameras are sensitive enough, but they are very expensive. Some sensitive photographic film emulsions can be used, but the results are not in real time. There is however one device that has been around for a very long time and is available quite cheaply. This is the photomultiplier tube.
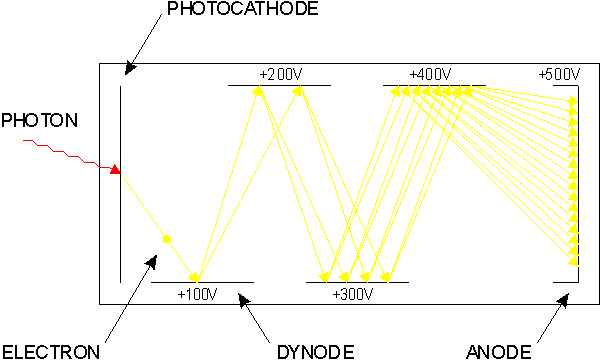
The photomultiplier tube (PMT) is based upon two main principles; the photoelectric effect and the secondary emission of electrons. The diagram above shows the basic structure. The end window of the tube is coated on the inside with a compound from which electrons are easily released by the interaction of a photon. This is the photocathode. An incident photon ejects a single electron from the photocathode. This single electron is attracted by an electrostatic field to an intermediate electrode called a dynode. The applied field accelerates the electron, giving it enough energy to release perhaps three or four secondary electrons. These electrons are accelerated to a second dynode, where they together release around 12 electrons. This multiplication continues for typically 11 dynodes, giving the PMT a gain of around 106 (a million). This produces a pulse of charge large enough to be measured by an external circuit.
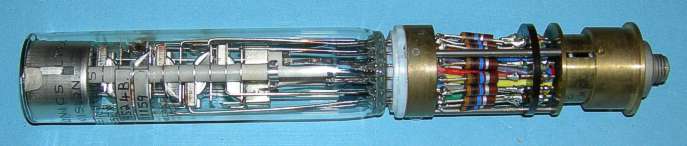
The PMT that I have used for this experiment is shown above. It is a rather old Thorn EMI type 9524B. It has 11 dynodes and a gain of 1.7x10⁶. The resistors on the right hand side form a resistor divider chain that provides the voltages for the dynodes. The end window of the PMT is 30mm in diameter with an S11 (SbCs) photocathode.
Not every photon that arrives at the photocathode gets detected. The percentage of photons that produce an electron is called the quantum efficiency QE. The value of QE varies with wavelength in a way that depends upon the photocathode material. The peak QE of S11 is about 30% at 350nm. This falls off to less than 1% at 300nm and 600nm. This makes the choice of laser wavelength for the experiment an important consideration. I have used a blue laser with a wavelength of 405nm. The S11 photocathode has a QE of around 25% at 405nm.
When a PMT is in complete darkness it still produces output pulses, although at a low rate. This is called the dark count and is due to a number of sources including electrons emitted from the photocathode and dynodes, radioactivity in the glass envelope and cosmic rays. Many of the dark count pulses are smaller in amplitude than real photon pulses and this makes it possible to reject (ignore) these pulses. This is accomplished by an amplitude discriminator. The discriminator only allows pulses through if they are above a preset level. This level is adjusted to provide the best compromise between rejecting dark counts (noise) and counting all real events (signal). When this is done, a dark count rate still remains. This is mainly caused by thermionic emission from the photocathode. it can be greatly reduced by cooling the PMT, but this requires more hardware, can cause condensation problems and results in a loss of sensitivity at the red end of the spectrum.
Everything emits black-body radiation because it is quite hot in absolute terms (290K). This means that even though the experiment has been made light-tight, it will be full of photons emitted from the internal surfaces. Fortunately, these photons are in the infra-red and have insufficient energy to release electrons from the photocathode of the PMT. Hence, they have no effect on the experiment and can be ignored.
The project was constructed almost entirely from surplus parts and items bought on eBay. There are two main parts to the experiment. There is a light-tight housing containing all of the optical components. There is also a 19" circuit card-frame which contains most of the electronics.
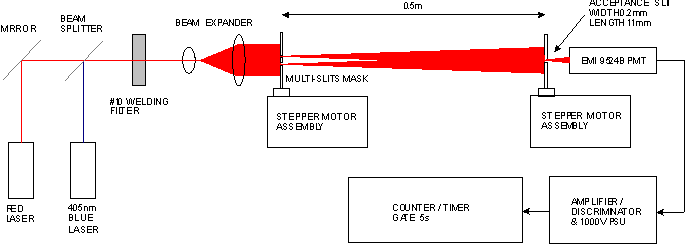
The basic arrangement of the experiment is shown in the above diagram. On the left is the 405nm laser. There is also a red laser to allow the effect of changing the wavelength to be explored. The lasers can be turned on and off independently. The laser beams are combined by a beam splitter.
To bring the intensity down towards 'photon at a time' levels, a piece of #10 welding filter has been used. The welding filter is designed to block ultra-violet radiation to protect the welder's eyes. As the 405nm laser is near ultra-violet, the attenuation provided by the welding filter is considerable. I have estimated the attenuation to be 174000. The attenuation of the red beam is less, but the resulting photon count rate is similar to that of the blue laser because the QE of the PMT is much lower in the red.
The welding filter is followed by a beam expander consisting of two positive lenses. The lenses are spaced apart by the sum of their focal lengths (f1+f2). This expands the beam by the ratio f2/f1.
After the beam expander is a first surface 'exit' mirror with fine adjustment for alignment. This is not shown in the diagram. After the mirror is the slit mask. The slit mask actually consists of several masks on one foil. A mechanism selects the desired mask.
After the slit mask is a 0.5m length of 40mm diameter waste pipe. This is the region of the experiment where the photons are able to 'spread out' from the slits and produce interference. At the end of the pipe is the acceptance slit.
Although a PMT is sensitive enough to detect single photons it is not an imaging device. It can only detect that a photon has interacted with the photocathode. It can not provide any information as to where that interaction occurred. Fortunately, the diffraction pattern produced by a double slit only contains information in one dimension. This makes imaging by mechanical scanning a simple solution. To image the diffraction pattern, a 0.2mm wide slit is swept across the pattern in small steps and the photon count rate is measured at each position. Plotting a graph of count rate versus position reveals the diffraction pattern. To count the photons, the output of the PMT is fed into an amplifier / discriminator and then a counter / timer.
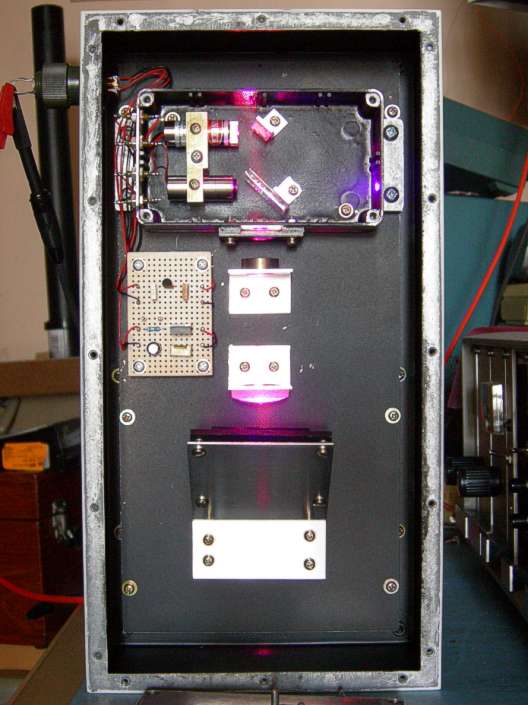
All of the optical components up to and including the slits mask are contained in the above 'Head Box'. Most of the internal surfaces have been sprayed matt black to minimize reflection of stray light.
The lasers are contained in an inner housing (top) with the welding filter mounted where the beams exit. This is necessary to prevent light scattered from the un-attenuated beams reaching the exit mirror. In the above photograph, the welding filter has not been fitted.
The beam expander consists of the two lenses mounted in the middle of the main housing, next to the circuit board. The circuit board carries the regulators for the lasers.
The large angled aluminium plate at the bottom of the picture carries the exit mirror. The mirror is mounted on springs and its angle can be adjusted by screws through the springs.
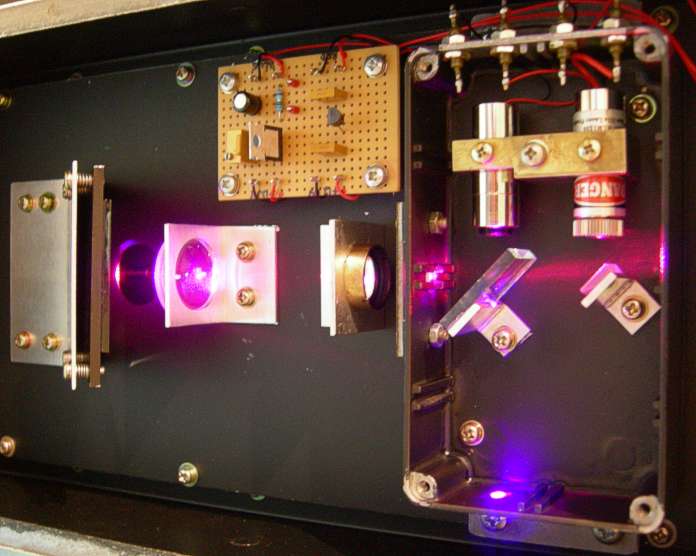
Above is a closer shot of the head optics. The red laser is at the far right of the picture. The beams are combined by the beam splitter and mirror (right middle). The exit mirror and exit hole can be seen on the left.
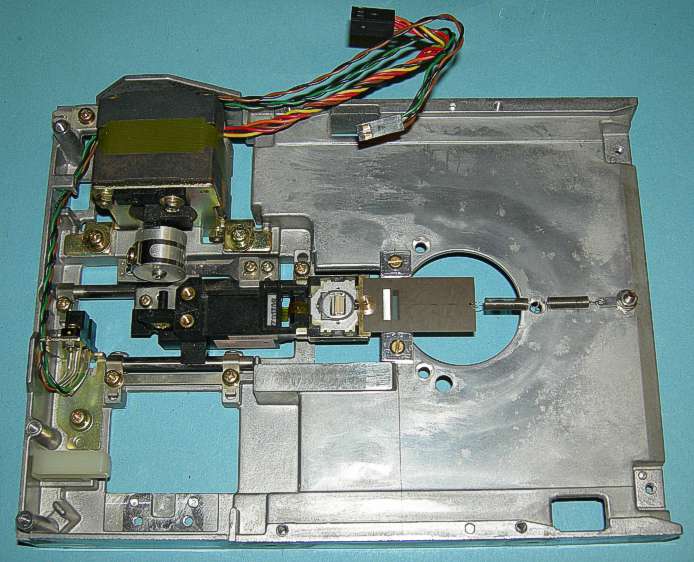
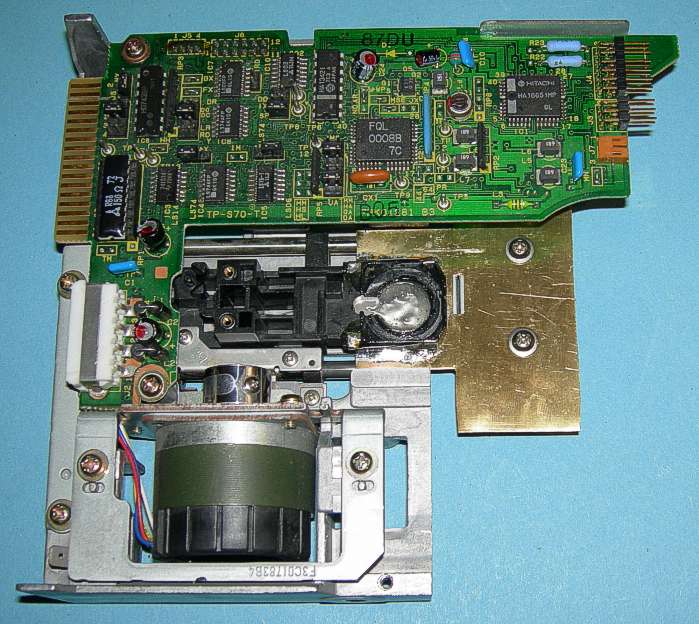
I wanted to be able to select between a range of slit masks so that the relationship between the mask (object) and the diffraction pattern could be explored. My first solution consisted of an 'aperture wheel' driven by a motor and gearbox. Optical encoders could not be used to detect the position of the wheel, because light from the encoders would reach the PMT. I therefore used micro-switches. The mechanism worked, but it was obvious that it was not going to be very reliable and alignment was going to be very difficult. I therefore decided to start again and use a stripped-down 5.25" floppy disc drive (FDD). The photo above shows the stripped-down FDD with only the head stepping mechanism remaining.
The read / write head of a 5.25" high density FDD moves in 80 steps of 0.2646mm. The mechanism is very accurate and reliable. Furthermore, all the drive electronics is there and the interface is simple.
To turn a 5.25" FDD into a slit mask changer, I had a 'multi-mask' specially made by Tecan. Tecan used Photo Electro Forming (PEF) to engineer 0.04mm slits with high precision. PEF is effectively the reverse of etching. Photoresist on a mandrel is exposed to UV light through an artwork. The photoresist is then developed to become a negative of the final mask. Metal is then plated onto the mandrel where there is no photoresist. The photoresist and mandrel are then removed. The distance between each mask is 2.91mm corresponding to 11 steps of the mechanism.
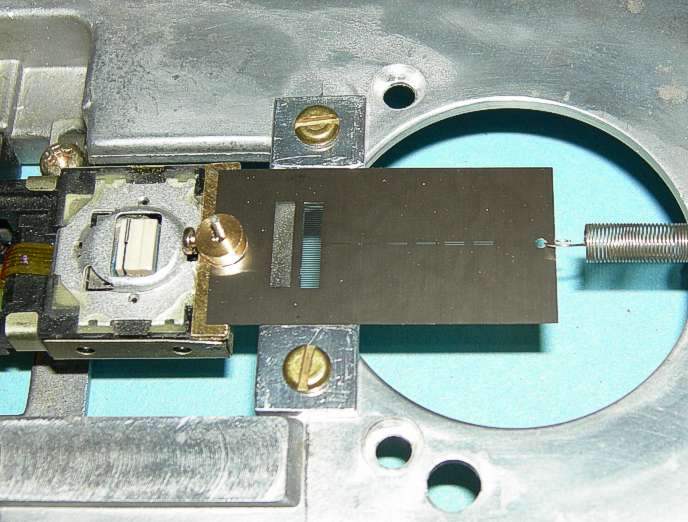
Above is a close-up of the multi-mask attached to the FDD head. The aluminium block held by the two brass screws selects the desired mask and keeps it in alignment. The spring keeps the multi-mask under tension.
The multi-mask carries eight different masks. There are four double slit masks with different combinations of slit separation and slit width. There are two single slits of different widths. There are also two square-wave gratings. Disappointingly (and for no fault of Tecan's) the square-wave gratings gave poor results and have been inhibited from use. This leaves six available slit combinations.
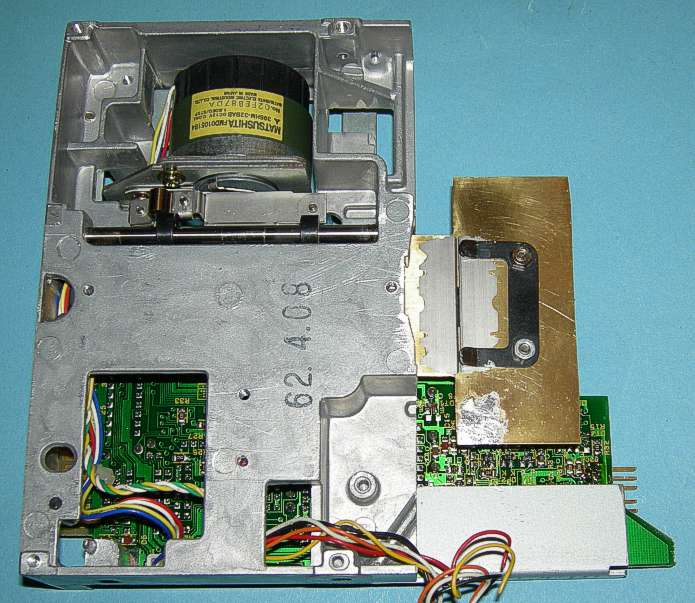
Above is the FDD with the control electronics board reinstated. The aluminium plate protects the masks and provides something to mount the circuit board back on to. A piece had to be cut out of the circuit board to clear the mask aperture.
In the photo above, the mask changer is mounted in the Head Box. The lasers, beam expander and other optics are on the other side of the bulkhead.
The +5V, +12V and 0V power connections, the head step direction and head step logic inputs and the track 0 detect logic output are wired to a six pole connector. The connector was made light-tight with black MS polymer (modified silicone) sealant.
After passing through the selected mask, the remaining photons pass through just under 0.5m of 40mm diameter black waste pipe to the 'Tail Box'. In the Tail Box is the acceptance slit and the PMT.
Another high density 5.25" FDD was used to move the acceptance slit. A brass plate with the acceptance slit fitted to it was simply glued to the head mounting of the FDD.
The diffraction slit dimensions and mask to acceptance slit distance had to be chosen carefully. The fringes of the closest slits must be resolvable when using the blue laser. The central maxima of the widest single slit must also fit in the span of the acceptance slit when using the red laser.
The acceptance slit was made from a cut-up razor blade. The slit was adjusted to 0.2mm using a feeler gauge.
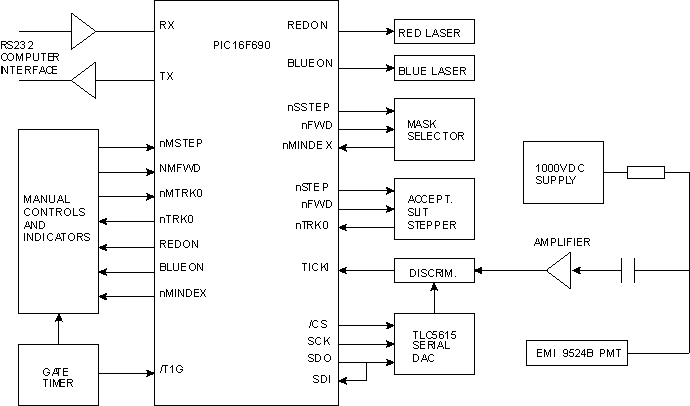
A block diagram of the electronics is shown above. At the centre of everything is a PIC microcontroller. The lasers, mask selector and acceptance slit stepper are controlled by the PIC micro. The PMT is powered by a 1000V DC to DC converter module. The output of the PMT is amplified and fed into a discriminator. The discriminator level is set by the PIC micro via a serial digital to analogue converter (DAC). The output from the discriminator is a series of 5V pulses that represent detection of a photon. The photon counting is handled by the PIC micro. All control of the experiment is via an RS232 serial link from a computer.
The PIC micro counts photons for a period defined by an external gate timer (bottom left block). The gate timer has been set to 5 seconds. Note that a relatively long counting time is required due to the random behaviour of the photons. The average rate has to be measured, as the time between events is random. A 5 second counting time gives a reasonable compromise between measurement time and counting statistics at low count rates. At the end of the gate time, the contents of the counter represents the number of photon counts in 5 seconds. Dividing this result by 5 gives counts per second (CPS). This division is performed in the external computer (not shown).
The PIC micro was programmed in assembly language. If you are interested, you can view or download the listing here.
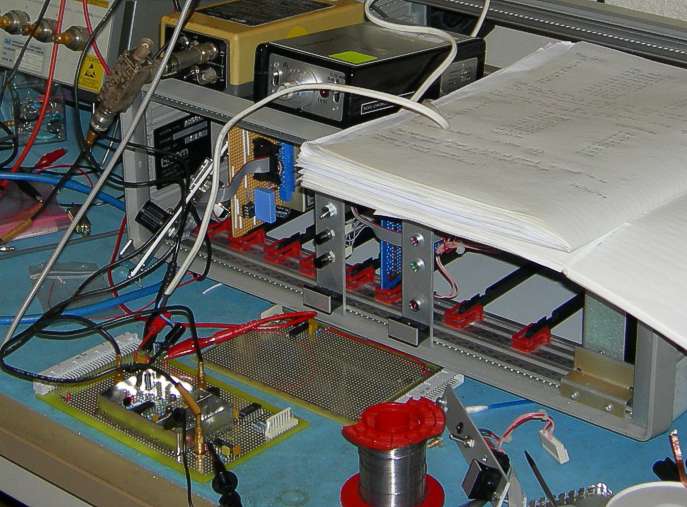
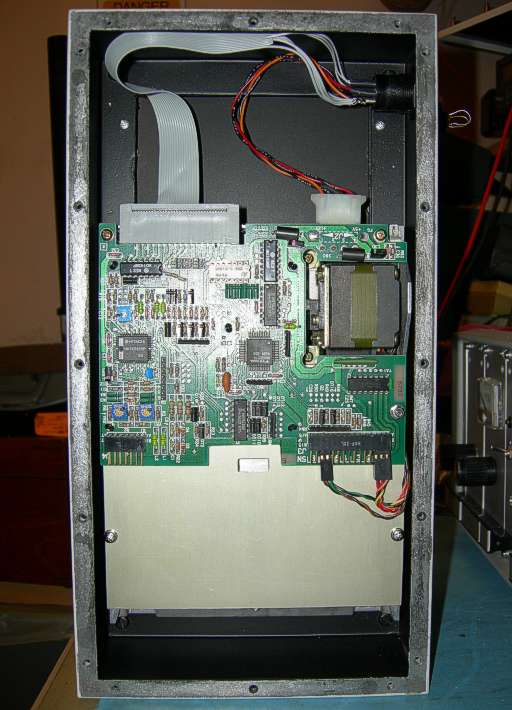
The electronics was built on 160mm by 100mm prototyping boards which are plugged into a 19" card-frame. The card frame had previously housed Arcom processor boards.
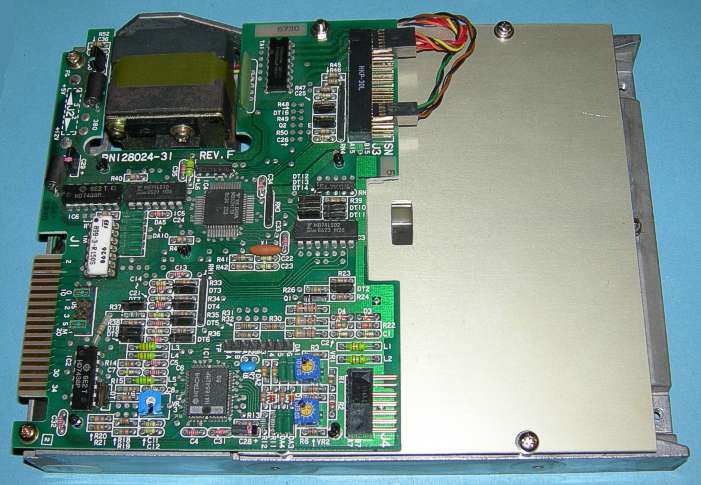
Above is the PMT amplifier / discriminator board and the 19" card frame under development.
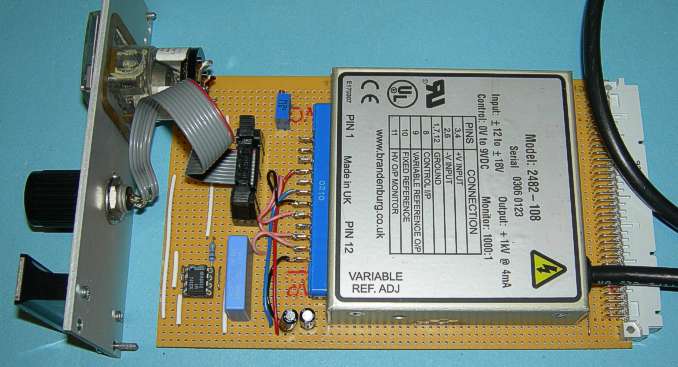
The PMT requires a very smooth 1000V dc supply for operation. This is provided by a DC to DC converter module. The IC bottom-left is an operational amplifier to drive the front panel volt-meter.
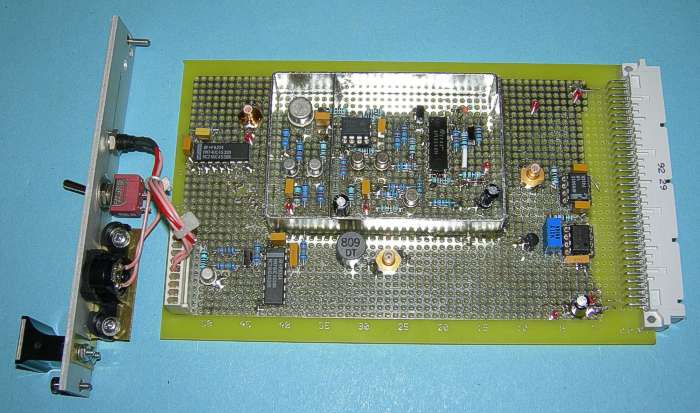
Above is the photomultiplier tube (PMT) amplifier / discriminator with the screening can lid removed. It is a wide-bandwidth charge-sensitive amplifier. Each time a photon is detected, the PMT outputs a negative pulse of charge with a duration of 10 to 20ns. There are also smaller noise pulses which need to be rejected. This is the purpose of the discriminator. The discriminator level is computer controlled via a serial digital to analogue converter (the bottom right 8 pin DIP). The multi-turn preset sets the maximum discriminator level.
After the discriminator there is a monostable that stretches the pulses from around 50ns in duration to around 1.6us in duration for counting. There is also a speaker driver that can be switched on via a toggle switch on the front panel. This produces an audible click each time a photon is detected.
Due to the wide bandwidth of the amplifier and the relatively small input signal levels, high frequency construction techniques are necessary. The prototype board is a pad board underneath with a ground plane on top. Component pins that require grounding are soldered to the ground plane on the top of the board. The connections between components are made by point-to-point wiring under the board using 0.2mm diameter polyurethane coated wire. The screening can is soldered to the ground plane and there is a partition between the main amplifier and the output stage to prevent oscillation due to stray capacitance.
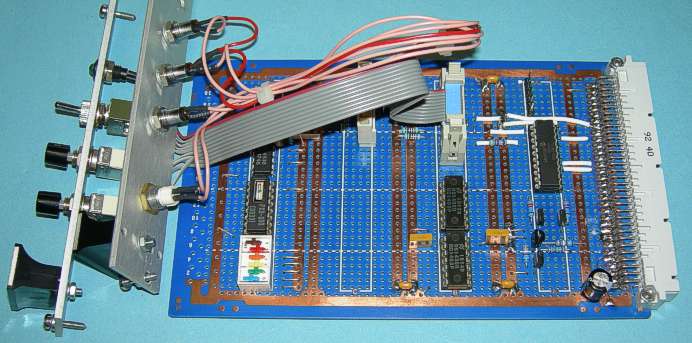
The microcontroller board is shown above. Everything is controlled via a PIC16F690 microcontroller. The lasers are turned on and off by the transistors (bottom right). The PIC micro has an on-board Synchronous Serial Port (SSP) that is used to control the discriminator level DAC on the Amplifier / Discriminator board. The PIC micro has an on-board counter / timer which is used to measure the photon count rate. The gate signal is generated externally from the PIC micro by a programmable crystal oscillator. The oscillator is the 16 pin IC bottom left. The gate time is set to 5 seconds by the DIP switches. The PIC micro also has an on on-board USART which is used to allow all control of the experiment to be controlled over a bi-directional RS232 link. The 5V logic levels are converted to RS232 levels by driver and receiver ICs (bottom middle). The controls and LEDs on the panels (left) are used for testing and fault-finding purposes. The experiment is designed to be fully controlled from a computer.
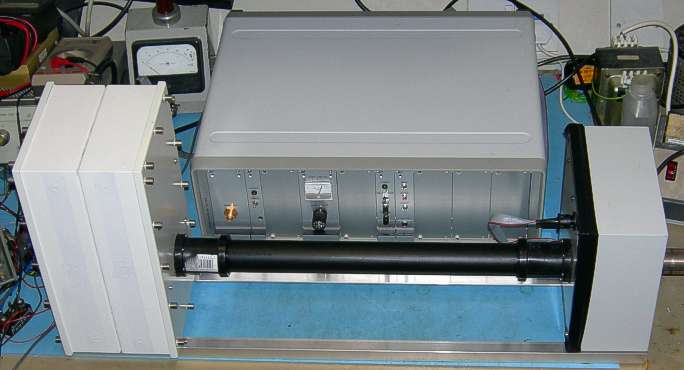
The completed experiment is shown above. The box on the left contains the lasers, beam expander and mask changer. The box on the right contains the acceptance slit stepper and photomultiplier tube (PMT). The PMT housing extends to the right of the box. The interference occurs in the black waste pipe between the two boxes. The photons don't seem to mind. The larger box at the rear contains the electronics.
Justification that the experiment is actually operating at 'photon at a time' levels is made on the next page.
| Page Title | Description |
|---|---|
| Background | Introduction to diffraction and Young's slits. |
| Information Encoding | This page attempts to show the similarities between the frequency content of an electrical waveform and the diffraction pattern of an object. |
| Single Photon Justification | Mathematical justification that the experiment can be considered to be diffracting individual photons. |
| Quiz | A multiple choice quiz (requires Java). |
| Instructions | Instructions for operation of the experiment. |
| Online Experiment | The live interactive Young's slits experiment. Please read the instructions first. |
| Conclusion | Conclusion and references. |
| Previous Page | Experiments Menu | Main Menu | Next Page |
|---|