Electrocardiogram (ECG)
I was trying to think of something to do, so I decided to see if I could measure my
electrocardiogram (ECG) using an oscilloscope.
This experiment is potentially dangerous. Commercial ECG machines are carefully
designed to ensure that the electrodes can not become live if a fault develops. The
electrodes are attached to get a good signal from the heart. Unfortunately the same
could be true in reverse. It would only take a few tens of milliamps to stop the
heart.
When muscles contract, there is an associated electrical change called depolarisation.
The resulting voltage pulse can be detected on the surface of the skin. The human heart
has four chambers; two atria and two ventricles. The two atria contract at the same time
followed by the ventricles, which also contract together. Three pulses are detected,
one for the atria contracting, one for the ventricles contracting and then one when the
ventricles relax.
 Measuring the ECG presents a few difficulties. The signal amplitude is about 1mV, which
would be easy to measure in an electronic circuit. Unfortunately, the mains noise picked
up by a human body can easily exceed 1V into 1MΩ. Grounding the body reduces the
noise to around 2mV peak to peak. The ECG pulses can then be seen, but only on top of
the noise. To get a clean trace, a differential amplifier is required.
Measuring the ECG presents a few difficulties. The signal amplitude is about 1mV, which
would be easy to measure in an electronic circuit. Unfortunately, the mains noise picked
up by a human body can easily exceed 1V into 1MΩ. Grounding the body reduces the
noise to around 2mV peak to peak. The ECG pulses can then be seen, but only on top of
the noise. To get a clean trace, a differential amplifier is required.
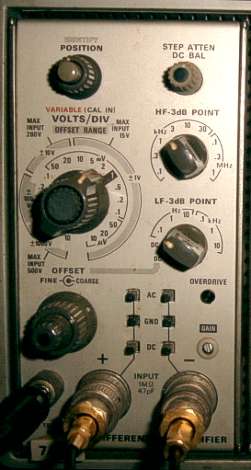
I used a 7A22 differential amplifier plug-in, in an elderly Tektronix 7603 analogue
oscilloscope. It has a very wide sensitivity range and high and low pass filters.
The signal is very slow, requiring a time-base speed of about 200ms per division. The
signal can be seen on an analogue oscilloscope, but not very clearly. In order to capture
the traces, I used a Pico ADC-200, PC based digital storage oscilloscope. The Y output of
the Tektronix 7603 oscilloscope was connected to Channel 1 of the Pico ADC-200.
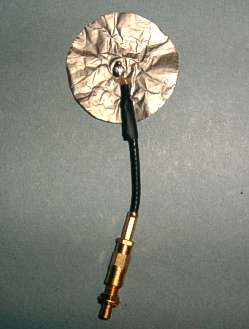 There is also the problem of getting a good electrical connection to the skin.
Professionals use special electrodes and conductive paste. I used nickel foil disks,
tissue paper soaked in salt water and Sellotape. A picture of one of the improvised
electrodes is shown on the left. The electrodes were connected to the differential
amplifier via RG174 coaxial cable to minimize noise pick-up. This type of cable is
light-weight and so does not pull the electrodes off.
There is also the problem of getting a good electrical connection to the skin.
Professionals use special electrodes and conductive paste. I used nickel foil disks,
tissue paper soaked in salt water and Sellotape. A picture of one of the improvised
electrodes is shown on the left. The electrodes were connected to the differential
amplifier via RG174 coaxial cable to minimize noise pick-up. This type of cable is
light-weight and so does not pull the electrodes off.
Commercial machines typically use 12 electrodes to look at the electrical activity of
the heart in different planes.
As all muscles produce electrical activity, it is important to keep still. That was a bit
of a problem as I was measuring myself. I also found that putting my hand on the computers
mouse picked up high frequency interference. I had to press the mouse button with a ruler.
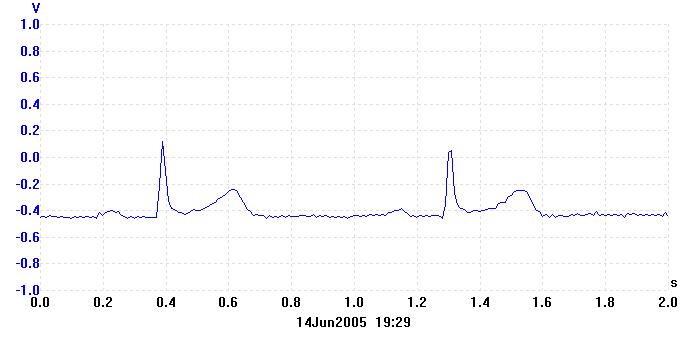
Below is a trace which I obtained with the positive electrode on the front of my left
shoulder and the negative electrode on the front of my right shoulder. I also had an
earthed spoon stuck in my mouth. The high pass filter was set to 3kHz and the low
pass to 0.1Hz. I found those settings to cause minimal distortion while reducing
the noise. The inputs of the differential amplifier and the Pico scope were DC coupled.
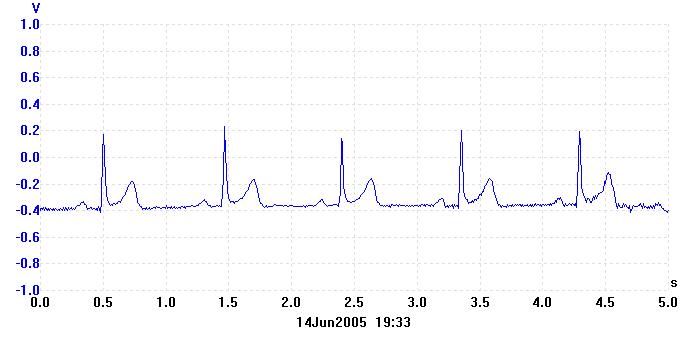
The vertical scale is not correct due to the additional gain of the differential
amplifier. The largest peak at 0.4 seconds is actually around 1mV in amplitude.
The period is about 0.92 seconds, giving a heart rate of 65 beats per minute. The first
small pulse at 0.2 seconds is the atria contracting. The next pulse at 0.4 seconds is the
left and right ventricles contracting. The medium height pulse at 0.6 seconds is the
ventricles relaxing. The sequence then repeats. The pulses associated with the ventricles
are largest because their muscle mass is greatest.
 Listen to the signal. (It is mostly low frequencies, so it is not clear with small speakers.)
32kB MP3 file.
The next trace shows the same thing but with a slower timebase setting.